
Published on May 21, 2021
Share The Post


This article reviews the most widely used display advertising KPIs. We also go deeper into lesser known ways of measuring the effectiveness of your display advertising campaigns.
We’ve broken down the display advertising KPIs following the buyer's journey, or engagement funnel, from Reach to Engagement to Results.
Display Advertising KPIs - Reach
The first display advertising KPIs are related to the reach of your campaign, how many people did you reach? This can actually be measured a few different ways.
Impressions: The number of times your ad was served. Note that this doesn’t mean that your ad was seen, simply that it was served somewhere on a page that someone opened.
Which leads us to...
Viewable Impressions: An ad may have been served on a page, but did anyone actually see it? This is difficult to measure directly, but the ad industry has set a standard that a static display or HTML5 ad is considered viewable when 50% of the ad shows on the screen for a second or longer. For video ads, it’s considered viewable if it shows for 2 seconds or longer.
Number of sites (domains) served: If you have access to your bid stream data (like Beeswax gives you!), you should be able to easily report on the sites in which your ads were displayed. With a platform like Beeswax that gives you granular control over your bidding strategies, you can adjust your bidding on the fly to ensure that you’re reaching all of the sites that you need to be to fully get at your intended audience.
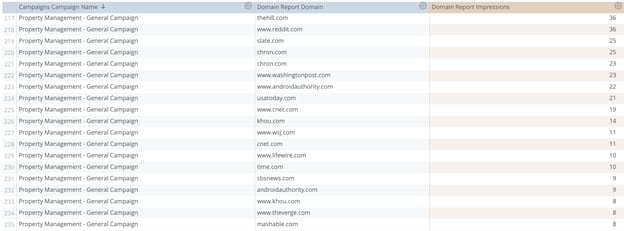
An example of Beeswax Bid stream data showing the sites reached by a campaign and the number of impressions so far on each site.
CPMs (Cost Per Thousand Impressions): This is an indicator of the cost of the reach that you’re delivering.
Spend: This is the accumulated amount of money spent to gain a given set of impressions. This is usually reported at a campaign or line item level.
Display Advertising KPIs - Engagement:
Once you’ve determined that you’re reaching the audience that you want to, to the maximum extent that your budget allows, then you want to begin to assess the effectiveness of your campaign, including the targeting models you’re using and the ad creative and messaging.
Clicks: is a measure of one of the specific actions that can be taken when someone views one of your ads. It helps you to understand how well your audience is responding to your marketing message.
CTR (Click Through Rate): is the number of clicks / number of impressions. This helps you to normalize your data, as one ad campaign or creative may be getting a lot of clicks relative to others, but when normalized against the number of impressions served may actually be underperforming vs. another campaign. CTR helps you to do things like A/B test to improve campaign performance and to allocate budget to campaigns and ad creatives that will bring more visitors to your site.
CPC (Cost Per Click): Is the cost of a campaign / the number of clicks it delivered. It’s a helpful budget allocation tool as it may be the case that a CTR for one campaign is higher than another, but because the 2nd campaign's CPM rate is significantly lower, the CPC of the second campaign is actually lower. This means that by increasing the budget to the second campaign, you can bring more traffic to your site for a given budget.
Display Advertising KPIs - Results:
Conversions (sometimes called ‘Actions’): Most display advertising tools will allow you to place a script (piece of code) on your site that will tell the tool when specific pages ‘fire’ (are opened). A good practice is to redirect a landing or shopping page to a thank you page after a desirable action is taken by a visitor. When this page ‘fires’, the advertising tool will count this as a win, or ‘conversion’.
CPA (Cost Per Action): By taking campaign spend and dividing it by the number of conversions, or actions, you can determine a Cost Per Action for a given campaign.
Revenue Generated: This is the revenue generated by a campaign. The ability to discern the revenue generated by a campaign can depend on the display advertising KPIs that you're able to measure. For instance, with access to bid stream data (like Beeswax BaaS™ provides!), you’re able to get at deep display advertising KPIs such as View-through Conversions.
View-through Conversions: Are conversions attributable to someone seeing an ad, but not clicking, and then coming to your site later and converting.
RoAS: Return on Ad Spend is an aggregated display advertising KPI, taking the total revenue and dividing it by the total investment. The total revenue can be tricky to ascertain as we discuss below.
Determining the Revenue Generated by a given campaign, or by your display advertising as a whole can be a bit tricky. Attributing a given transaction to a specific campaign can depend upon the Attribution Model that you are using.
For display advertising as a whole, often a goal is ‘brand building’. A stronger brand can impact revenue in a wide variety of ways that are very difficult to measure directly. More on this below.
Display Advertising KPIs - More Than Impressions & Clicks
In the HBR article Do Display Ads Influence Search Attribution and Dynamics in Online Advertising, the authors make a compelling case for the marketing results of display advertising actually manifesting in search activity vs in display ad clicks.
That means that the most important display advertising KPIs may actually not be those that are delivered by your advertising tool.
Savvy marketers have their analytics in place to measure a lift in page views and new users visiting the site via organic search to see if there’s a discernible difference in traffic before and after display advertising campaigns.
Since a goal of display advertising can be to build brand awareness, by having brand adwords campaigns running, you can look at the underlying campaign data to see if there’s an increase in brand searches while running display ad campaigns.
More difficult to measure are the effects of a stronger brand. Are sales cycles shorter? Are there fewer clicks-to-purchase? Has store foot traffic increased? A display advertising campaign can influence all of these, and the data may be a bit anecdotal but it may be possible to extract meaningful insights from watching these types of KPIs as they correlate with the timing of display advertising campaigns.

Back to the Blog
Share The Post